General Auto Insurance Statistics
While most drivers carry auto insurance, a significant portion of the U.S. population drives uninsured illegally. Globally, the industry adds more than $880 billion to the economy and employs nearly 300,000 individuals.
- In 2015, 203 million private passenger vehicles were insured in the United States (excluding Texas). California had the most insured private passenger cars (26.3 million), followed by Florida (12.7 million) and New York (9.6 million).
- In 2019, 36% of Millennials purchased their U.S. auto insurance online. Comparatively, Baby Boomers preferred to buy from exclusive agents.
- The auto insurance industry employs approximately 279,000 people and is worth $288.4 billion in the U.S. Globally, the sector is estimated to be worth over $880 billion.
- 87% of American drivers have some form of auto insurance. The remaining 13% (about 32 million) are driving uninsured illegally or living in a state that doesn’t require car insurance. [1, 2, 5, 6]
Auto Insurance Statistics by State
Insurance costs—and whether you need coverage in the first place—can vary significantly by state.
- There are no federal laws mandating auto insurance for drivers in the U.S. Instead, each state has its own rules.
- In 49 of 50 states (all except for New Hampshire), auto insurance is required by law. However, the UK was the first country to make vehicle insurance policies compulsory in 1930.
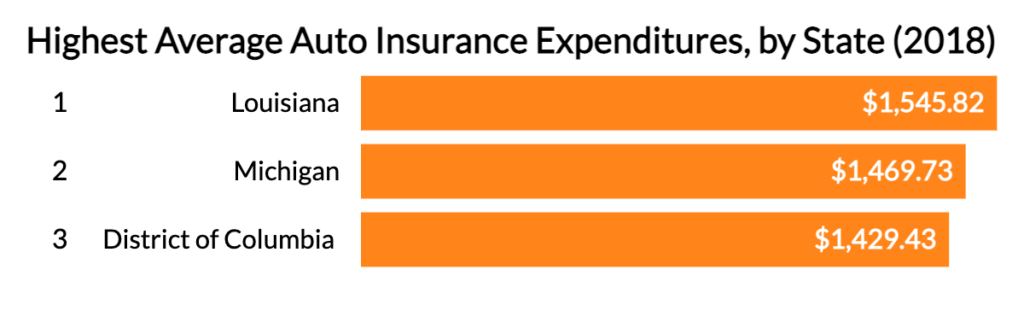
- In 2018, the average auto insurance expenditure was highest in Louisiana ($1,545.82), followed by Michigan ($1,469.73) and the District of Columbia ($1,429.43).
- The three least expensive states were North Dakota ($686.08), Maine ($686.25), and Iowa ($700.71).
- As a percent of median household income, Louisiana ranked highest (3.09%), and Iowa ranked lowest (1.02%).
- Nearly 30% of Mississippi drivers are uninsured, which decreased to 27% in Florida. [1, 2, 4, 6]
Auto Insurance Statistics by Cost
While auto insurance costs have trended upward over the past several years, they decreased between 2019 and 2020, perhaps due to less overall driving as a result of the COVID-19 pandemic.
- Americans spend around 3% of their annual incomes on auto insurance.
- Between 2019 and 2020, the average cost of motor vehicle insurance declined by 4.6%.
- The average expenditure for auto insurance was $1,056.55 in 2018, up significantly from $786.65 in 2009.
- In 2020, insurance companies wrote $99,606,206 in net collision and comprehensive premiums, which was down from $100,443,264 in 2019. Liability net premiums were $144,110,581.
- As of 2019, the auto insurance industry was worth about $311 billion.
- The nonstandard auto market generated $16.9 billion in direct premiums in 2019.
- Each year, motor vehicle crashes cost almost $1 trillion in losses.
- 78% of insured drivers purchase comprehensive coverage and liability insurance, and 74% buy collision coverage.
- If you receive a speeding ticket, your auto insurance premiums could increase by an average of $355. Other events and their associated premium increases include:
- Credit score decrease: $1,351
- Involved in a car accident: $731
- Lapse in coverage: $187
- DUI conviction: $1,662
- Insuring a teenage driver: $1,883
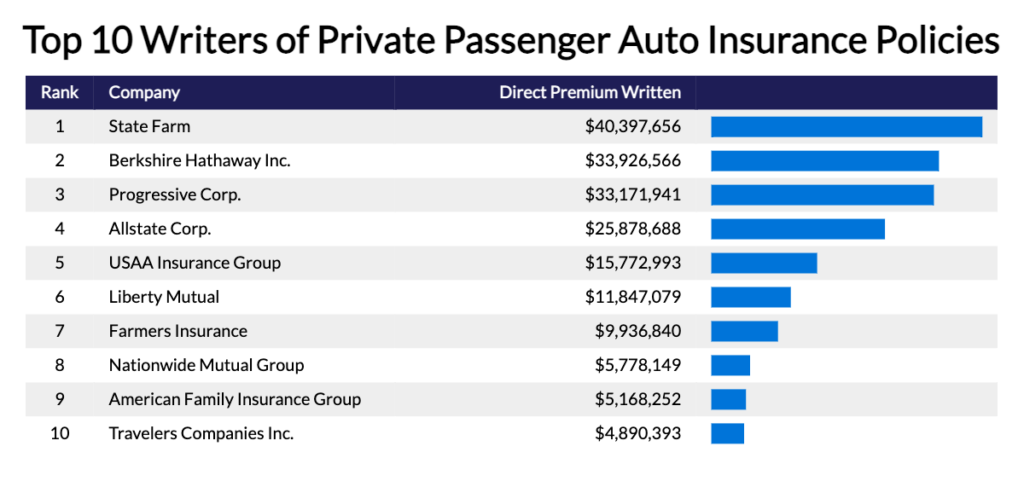
- The top 10 writers of private passenger auto insurance policies (by direct premiums written) include:
- State Farm: $40,397,656
- Berkshire Hathaway Inc.: $33,926,566
- Progressive Corp.: $33,171,941
- Allstate Corp.: $25,878,688
- USAA Insurance Group: $15,772,993
- Liberty Mutual: $11,847,079
- Farmers Insurance Group of Companies: $9,936,840
- Nationwide Mutual Group: $5,778,149
- American Family Insurance Group: $5,168,252
- Travelers Companies Inc.: $4,890,393 [1, 2, 3, 6]
Auto Insurance Statistics Related to Claims
Between 2019 and 2020, the average payouts for bodily injury, property damage, and comprehensive claims increased, half of which were paid by private insurers.
- In 2019, the average bodily injury payout was $18,417, property damage was $4,525, collision was $3,750, and comprehensive was $1,780.
- In 2020, the average bodily injury claim increased to $20,235, while property damage was $4,711. The average collision loss came in at $3,588 and $1,995 for comprehensive.
- 10 million+ crashes go unreported each year.
- Collision claims are most frequent, followed by comprehensive, property damage, and bodily injury.
- Among the reasons reported, speeding or racing is the most common for fatal crashes, followed by the influence of alcohol or drugs, distracted driving, and drowsy or fatigued driving.
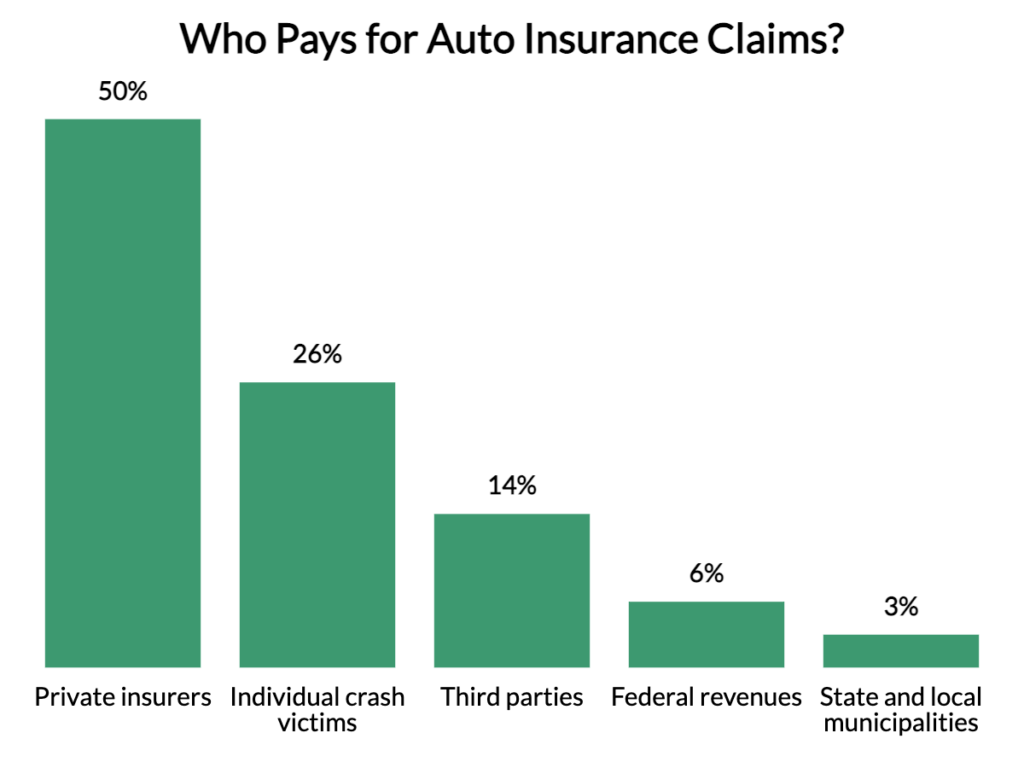
- Private insurers paid for 50% of all auto insurance claims, followed by:
- Individual crash victims: 26%
- Third parties, charities, and health care providers: 14%
- Federal revenues: 6%
- State and local municipalities: 3%
- Teen drivers are three times more likely than older drivers to get into a fatal car accident.
- Accidents involving male drivers tend to be more serious than accidents with female drivers.
- In 2018, there were over 34 thousand fatalities, about 1.8 million injuries, and approximately five million car crashes that involved property damage.
- In 2017, more than 750,000 cars were stolen at a total cost of nearly $6 billion. [1, 2, 4, 6]
Need More Information About Auto Insurance?
Statistics or otherwise, IHS Insurance Group is your one-stop shop for all things related to auto insurance. We’re here to answer your questions and provide any information that helps you make a wiser decision and saves you money.
Need a FREE Quote or have questions regarding Auto Insurance Coverage? We have two convenient ways to reach us:
- If you prefer to talk to a licensed agent directly, please call (866) 480-5063.
- If you prefer to fill out a quick form and have an agent get back to you at your convenience, use the GET A FREE QUOTE.
- Lastly, for those that want an immediate quote, please click HERE.
We look forward to speaking with you today!
Sources
- Insurance Information Institute. Facts + Statistics: Auto insurance. Accessed on 11/1/21.
- Bankrate.com. Auto insurance statistics and facts. Accessed on 11/1/21.
- Bankrate.com. The true cost of auto insurance in 2021. Accessed on 11/1/21.
- Statista. Car insurance in the U.S. – statistics & facts. Accessed on 11/1/21.
- Statista. Auto insurance purchase channels in the United States in 2019, by generation. Accessed on 11/1/21.
- PolicyAdvice. Auto Insurance Statistics for 2021. Accessed on 11/1/21.